Your number vs their number, every game, every week.
A Google Sheet that projects the score, spread and total for all 16 games, then sets your numbers next to the sportsbook’s.
Paste in two free stats tables. Five minutes on a Tuesday. 146-112 across tracked seasons, 60.47% last year, and positive closing line value against Pinnacle’s close.
7-day money back guarantee
| Game | My spread | The book | Gap |
|---|---|---|---|
| Steelers vs BillsPIT vs BUF | BillsBUF 13.03 | BillsBUF 10 | 3.03 |
| Packers vs CowboysGB vs DAL | CowboysDAL 11.07 | CowboysDAL 7 | 4.07 |
| Browns vs TexansCLE vs HOU | BrownsCLE 0.63 | BrownsCLE 2.5 | 1.87 |
| Rams vs LionsLAR vs DET | LionsDET 3.32 | LionsDET 3 | 0.32 |
Under a 7-point benchmark, none of these four is a bet. That is the point. Most weeks the sheet tells you to pass, and it tells you early enough to walk away.
Two minutes, and you will see exactly what you get
“Who do you like this week?”
I get asked that constantly, and I never have a good answer.
Because I do not think about teams. I think about prices.
The same team is a bet at +110 and a pass at -105. Nothing about the team changed. Only what you get paid for taking that side.
Most bettors never make that switch. They read the injury report, form an opinion, then take whatever number is on the screen.
To do it the other way you need one thing most bettors do not have.

A number of your own to compare against.
Building betting models since 1998
One screen. The whole week.
Every game on one screen, in three blocks.
- My projections. Projected score, raw spread and total for each game. Cowboys 27, Lions 37. Total 64.43.
- Minimum qualifying lines. This is the part most models leave out. It does not just show you a gap. It shows you the exact line where a game becomes a bet under your benchmark. Cowboys +17.5. Over 57. If you cannot get that number, you pass. The 7-point benchmark is the default and you can change it to whatever you want.
- The supporting stats. Team rankings, offensive and defensive points for, yards per play, pass net yards per attempt, rush yards per attempt. There if you want to dig, ignorable if you do not.
Then you compare against the board and bet the gaps.
If you can copy and paste, you can run this
No coding. No formulas to write. No statistics to learn. Nothing to install.
The whole weekly process:
- Open the sheet
- Copy two stats tables from football-reference and ESPN. Both free. About 10 seconds
- Select the week’s matchups
- Read the qualifying lines
Five minutes. Once a week.
I built the first version of this in 2004 and have been refining it since. You just use it.
And if you are comfortable in spreadsheets, nothing is locked. Change the weights, change the 7-point benchmark, build on top of it.
Decide on Tuesday, then close the laptop
Monday’s game is finished and the new lines are up.
You sit down at the laptop, run the projections and compare them to the prices. Anything that clears your criteria gets bet. Everything else gets ignored.
Five minutes at a desk. Then you close the laptop and you are done for the week.
That is how the model is meant to be used. Sit down once, with the full sheet in front of you on a real screen, and make the week’s decisions in one go. It is not a phone tool and it is not something you keep open and check all week.
No chasing lines on Sunday morning. No sweating live odds. No checking your phone at kickoff to see whether the number moved.
There are strategies built around Sunday line movement and some people do well with them. This is not one of them.
The decision is made on Tuesday. The rest of the week you are just watching football.
146-112 using this model
| Season | W | L | Win % |
|---|---|---|---|
| Past seasons | 59 | 46 | 56.19% |
| 2023 / 2024 | 22 | 16 | 57.89% |
| 2024 / 2025 | 39 | 33 | 54.17% |
| 2025 / 2026 | 26 | 17 | 60.47% |
| Total | 146 | 112 | 56.59% |
56.59% across tracked seasons. Breakeven at standard -110 is about 52.4%.
Last season: 26-17, +7.02 units, ROI +16.33%, 60.47%.
That is the record. Not a backtest. Not a projection.
The number almost nobody else will show you
Win rate can be luck. A hot month proves nothing.
Closing line value is different. It measures whether the price you took was better than the price the market settled on before kickoff.
If you keep betting at better numbers than the closing line, you were right about the price, whether or not the ball bounced your way.
In one season I tracked bet by bet, the model produced CLV of +3.81% and +4.25%, measured against Pinnacle’s closing number.
One season is still a small sample, so I am not presenting that as long-term proof. But it does show that, in that tracked season, the model was consistently getting better prices than the market’s final number.
In the NFL, where the market is about as sharp as it gets, that matters more to me than a hot win rate.
And here is the full log. Every bet, including the losing stretches.
Weeks 8, 10 and 13 all went backwards. That is what a real season looks like.
Anyone showing you a straight line up is showing you something they made in Photoshop.
The first three weeks are where this earns its keep
Nobody has current season data right now. Not you, not me, not the sportsbooks.
Every number on the board is built from last season, plus preseason games the teams did not care about, plus opinion.
So the market prices off noise and the public bets off headlines.
Weeks 1 to 3 only, same method each year:
| Season | Record | Units |
|---|---|---|
| 2023 / 2024 | 7-2 | +4.35 |
| 2024 / 2025 | 14-9 | +3.69 |
| 2025 / 2026 | 12-8 | +3.09 |
Last season those three weeks produced +3.09 units. The full season produced +7.02.
Nearly half the year’s profit came from the first three weeks.
Three weeks is a small sample and I am not presenting it as a guarantee. It could easily have gone the other way.
But it is why the price is $149 now and $299 once the season starts.
Read this before you buy
I would rather lose the sale than have you buy the wrong thing.
- It does not give you picks. It gives you a number and a qualifying line. You decide whether the price is worth it.
- It will not beat a professional trading desk. My projections can sit several points away from the closing line. The people running syndicates are inside a fraction of a point. This gives an ordinary bettor a consistent method, not an edge over the sharpest money in the market.
- It does not promise a winning season. The NFL has few games. A good method can lose over 50 or 100 bets and the season is over. That is math, not bad luck.
- It is a spreadsheet. Google Sheets. Works best on a laptop. If you only ever use a phone, you will find it awkward.
- You still have to open it. Five minutes a week is small, but it is not zero.
This is for you if
- You already bet NFL and you want a reason behind each bet
- You are willing to spend five minutes a week
- You would rather bet four games with a reason than fourteen on feel
- You want to understand why a price is good, not be told that it is
Skip this if
- You want someone to send you picks
- You expect a guaranteed profit this season
- You will not open a spreadsheet
Everything included
- The NFL model. Google Sheets. Projected score, spread and total for every game, plus your minimum qualifying lines and the supporting stats.
- The instruction video. One short video. Load it, run it, read it.
- Bonus 1: American Odds Bet Tracker.
- Bonus 2: Decimal Odds Bet Tracker. Both track closing line value, the same way I track mine above. Most trackers do not do this at all.
- Lifetime access to the NFL model. Pay once. No subscription and no renewal for the model. Yours this season and every season after it.
50 AI Assistant credits
In 2026, I built a separate tool called the Underdog Chance AI Assistant. I trained it to analyze games the way I would — looking at the matchup, the market and the price, then giving you a VALUE or PASS verdict.
I’ll add 50 credits free with your NFL model purchase so you can try it for yourself.
Each analysis is generated on demand when you request it. The AI actually goes through the game and produces a fresh analysis for you, which means every request has a real processing cost on my end.
The 50 credits are simply there for you to test the AI Assistant and see whether you find it useful.
The AI Assistant is a separate product and is not part of your lifetime NFL model access. Buying the NFL model does not start a subscription. If you use your 50 free credits and want to keep using the AI Assistant afterward, that is completely optional.
Bonus credits are added manually after purchase.
$149 one-time payment · No recurring fee for the NFL model.
7-day money back guarantee
Try the model for 7 days. Load it, run a week, see what it does.
If you do not see the value, email me and I refund you in full. No questions.
I only want happy bettors using this.
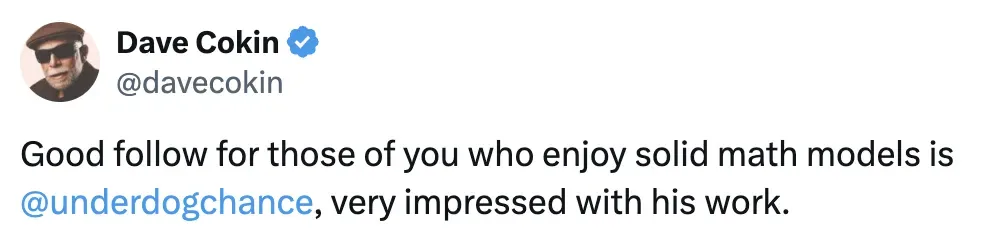
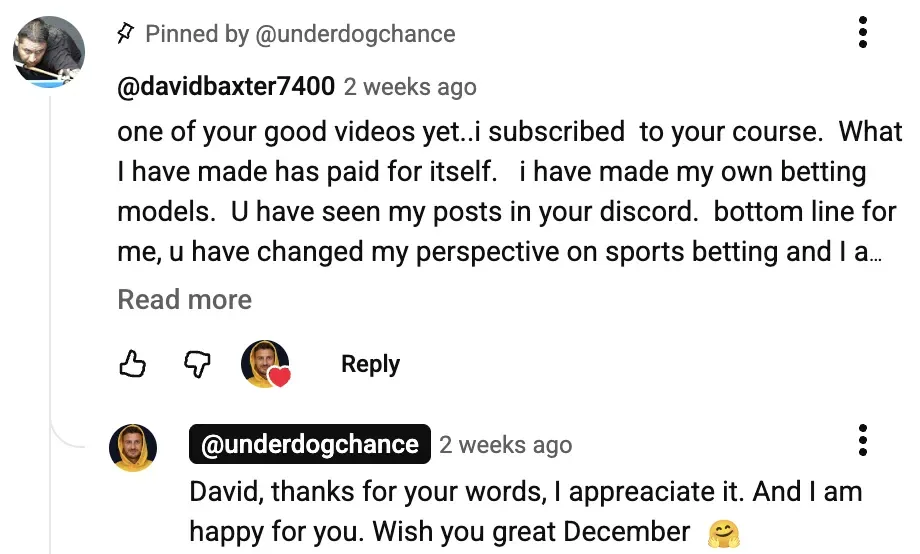
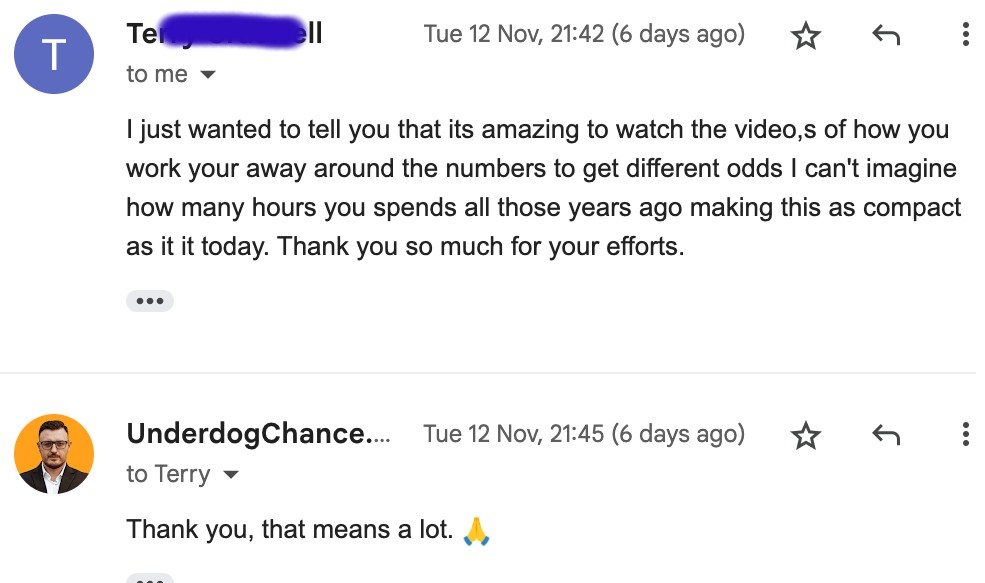
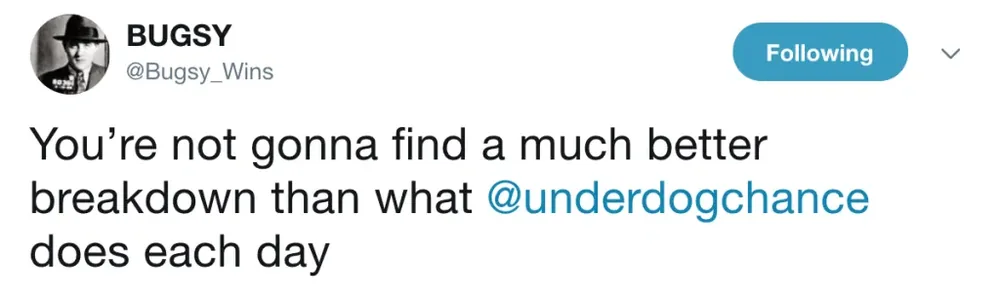
What people say about the way I work
Before you decide
Download the file, open it in Google Sheets, watch the short video. Select the teams and the model predicts the score, for example Chiefs 34.6 vs Dolphins 27.23, plus the spread and total. It then shows the minimum line that would make each game a bet under your chosen benchmark. The default is a 7-point difference.
No. The complex work is already done. You copy and paste two tables and select teams.
About 5 minutes. The copy and paste part is roughly 10 seconds.
No. The stats come from football-reference and ESPN. Both are free.
No. No monthly fee and no picks. You get a tool and a method, and you make your own decisions.
With picks you get an answer and no reason. When the seller goes quiet or the line moves before you get on, you have nothing.
Here you get the number the pick would have been based on. Next season you still have it, and the season after that.
Any. The model gives you a number. You compare it against whatever price you can get. Two or three accounts helps, because you take the best price available.
Yes. It is a spreadsheet and a probability. Your location does not matter.
Yes. You also get a video showing you exactly how the model works and how to update it for future NFL seasons. The update process is simple. So you’re not buying something that only works for this year. You’ll know how to refresh the inputs yourself and keep using the model in future seasons.
Closing line value. It compares the price you bet at against the price the market settled on before kickoff. If you consistently beat the close, your bets were well priced regardless of the results.
It is the most honest measure of whether a method is working, and it is what the bonus trackers track for you.
50 analyses inside the Underdog Chance AI Assistant. Tap a game, it estimates the true probability and returns VALUE or PASS on the price. Separate tool, included free.
No. There is no guarantee in sports betting and anyone offering one is lying to you. This raises the probability that your bets are priced well. It does not promise results.
Yes. The Sports Betting Masterclass covers more than ten private models and how I think about pricing bets. This page is only the NFL model. If you want the full method, email me at mb@underdogchance.com and I will point you to it.
The preseason price ends and the model goes back to $299. The page stays live.
Email me at mb@underdogchance.com and I will answer it myself.
The season starts Wednesday
Week 1 kicks off on September 9, and the price goes back to $299 at 2 PM ET the same day.
If you have been betting NFL on opinion for years and it has not worked, you already know what another season of that looks like.
Five minutes on a Tuesday is not a big ask.
7-day money back guarantee